3 helpful Power BI Tips for Beginners
- Soo Reed

- Nov 3, 2020
- 7 min read
Updated: Oct 3, 2022
3 Power BI Tips that will save you time, energy, and headache
Key Measure Table, variables in DAX, and hiding table in Power BI
When I started creating Power BI dashboards, I picked up these 3 helpful Power BI Tips for Beginners, and they became an important routine to create a quality dashboard with flexibility for future modification. Without the three tips I am about to share, any data source change or modification request would have taken so much longer and worse, could have deleted all my precious measures! So save yourself time, effort, and a headache by making sure you know these three tips and tricks I am about to share.
Let’s dig in!
Table of Content
Do you want to know what they are quickly and why you want them? Go and check out this infographic on 3 Helpful PowerBI Tips For Beginners and come back for detailed how-to.
1. always create a key measure table
Always, always, always create a measure table. It is simple and sometimes it may feel unnecessary, but I can’t stress enough how useful a measure table is and I can’t recount all the times the measure table saved so much work.
what is a key measure table?
A key measure table is a table you can create on Power BI where you can store all your measures.

why do I want to have this key measure table?
It is easy to find a measure. Not only will measures be all in one table, but also will the measure table be the first table in fields pane. It will also prevent you from creating the same measure again and it will make it easier for you to create measures that utilizes other measures.
Without a key measure table, you could lose all your measures. If you have to change a table’s datasource for any reason, all the measures that were stored in that table would be lost. If you have been saving the measures in the key measure table, then you will not lose any measure! And trust me, there will be times when you unexpectedly have to change the datasource and forget that all your measures were stored in the deleted table. Organized start gives you more flexibility in the future.
A key measure table makes your dashboard more readable. If you have to transfer your power bi dashboard to someone else, having all the measures together will make it so much easier for the new owner to dissect.
how do I make a key measure table?
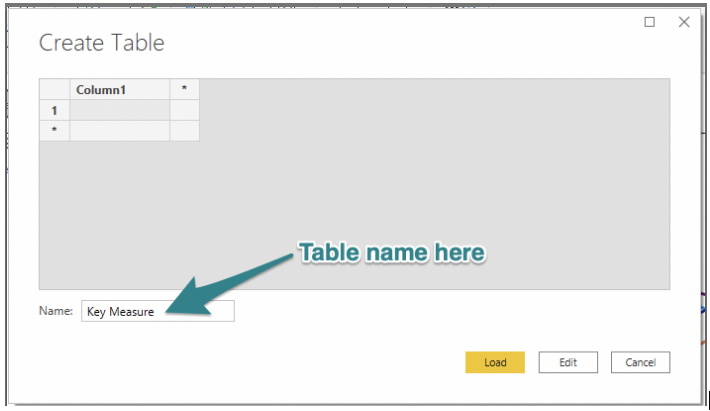
In the Power BI Home tab, click [Enter data]. It will give you a prompt where you can type a table name, column name, and values. You don’t need to put anything but a table name. Name the table “Key Measures”; you can actually name the table however you want, but you cannot make it “Measure” as that is a reserved name on Power BI. For the sake of clarity, I recommend any name with the word “Measures” in it.


Once the table is loaded, create a measure in the table by clicking the [option] (three dots) on the right end of the table as shown here:

This will show you options like the screenshot on the right; choose “New measure” to create one.
Once you create a measure (doesn’t matter what kind of measure it is!), then right click the column of the table (“Column 1”) and click delete. Once it is deleted, click the “>” icon next to Fields pane which will hide the pane.

Then you unhide the pane. You will notice the Key Measures Table now has a different icon (Calculator icon) and is located on top.
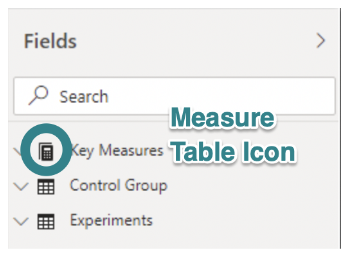
This means you have created a key measures table! Whenever you create a measure, make sure you create a measure in this table so you keep all the measures safely in this table.
What if I already created many measures in different tables?
Worry not! It’s easy to move the already created measures to your Key Measure table. To do so, click the measure you want to move and go to [Measure tools] tab on the ribbon. You will see [Home table] drop down, and choose the Key Measure table there.

2. use variables and separate lines for nested dax
If you are used to coding programming languages, you know how crucial it is to define variables and to organize your code by using the next line or space when needed (if you are used to Python, you are trained to do this!). Why not do the same with DAX? Doing so will help you debug when writing complex measures and will make it more legible whenever you have to come back to examine the measure again.
Why do I want to use variables and the next line?
It is easier for you to read. There will be times you will have to go back and check or tweak your measures. Again, organized start gives you more flexibility in the future.
It is easier for others to read. You will not be the owner of certain dashboards forever. It is important for you to pave the road for the ones who follow your path. Also, even if your dashboards stay under your management, when you create awesome dashboards with wizardly DAX skills, people will want to know and learn what you did. Why not help them by making it easier to digest while showing off how neatly written your codes are at the same time
Using “var” helps you debug a measure. When you are writing a complex measure and having an error, defining and using “var” helps you break down the measure into multiple parts and test each part to see where the error comes from.
How do I use variables in Power BI?
To define a variable within a measure, simply put “var” before a variable name and define it. When you want to define the measure at the end, write “return” before you put DAX code. It’s easier to understand when you see it. Here’s an example:
Conversion Rate Growth Rate = var controlV = CALCULATE([Control Conversion Rate], ALL(Experiments[experimentVariant])) var lift = ([Conversion rate]-controlV)/controlV return IF(SELECTEDVALUE(‘Control Group'[Control]) = SELECTEDVALUE(Experiments[experimentVariant]), BLANK(), iferror(lift, BLANK()))
**this dax example is from another blog post. If you want to know what’s happening here check out “How to create interactive growth rate calculation”.
In this example, I am defining variables “controlV” and “lift”. As you can see, the result of this measure will be determined by what is after “return”. If this code was not written using variable, it would look like this:
Conversion Rate Growth Rate = IF(SELECTEDVALUE(‘Control Group'[Control]) = SELECTEDVALUE(Experiments[experimentVariant]), BLANK(), iferror(([Conversion rate]- CALCULATE([Control Conversion Rate], ALL(Experiments[experimentVariant])))/ CALCULATE([Control Conversion Rate], ALL(Experiments[experimentVariant])), BLANK()))
Ugh, it is not easy to understand at all! If you have to debug the measure or have to come back to your measure in the future for any reason, you want it to be easy to digest. So yes, define variables.
Important note: these variables are only available within this measure. If you find yourself making the same variable more than once in different measures, then instead of defining a variable within a measure, you should create its own measure and utilize it in another measure. By doing so, you are creating more flexibility; if a lower level measure (the measure that gets utilized within a few different measures) needs to be changed, you only need to change it once and all the upper level measures will be changed accordingly!
How do I use the next lines in Power BI?
To use the next line when writing dax, simply use: [shift] + [enter]. It is simple, but powerful. See this example from the same blog post:
Control Conversion = IF(ISCROSSFILTERED(‘Control Group'[Control]), SWITCH(TRUE(), VALUES(‘Control Group'[Control]) = “0”, CALCULATE(SUM(Experiments[conversion]), FILTER(Experiments, Experiments[experimentVariant] = “0”)), VALUES(‘Control Group'[Control]) = “1”, CALCULATE(SUM(Experiments[conversion]), FILTER(Experiments, Experiments[ExperimentVariant] = “1”)), BLANK()) , BLANK())
If you don’t use the next line, then it would look like this:
Control Conversion = IF(ISCROSSFILTERED(‘Control Group'[Control]), SWITCH(TRUE(), VALUES(‘Control Group'[Control]) = “0”, CALCULATE(SUM(Experiments[conversion]), FILTER(Experiments, Experiments[experimentVariant] = “0”)), VALUES(‘Control Group'[Control]) = “1”, CALCULATE(SUM(Experiments[conversion]), FILTER(Experiments, Experiments[ExperimentVariant] = “1”)),BLANK()), BLANK())
Again, it is not easy to understand. Writing codes in an easily digestible way using simple tricks like variables and next lines can really save time and headache in the future!
Third tip - when you don’t use a table directly, hide it
For the third and the last tip, I want to show you how to declutter your field pane. There will be times you import a table but do not actually use its data directly; for instance, you may import a table so you can use LOOKUPVALUE() or UNION with another table into a new one. Either way, those tables can clutter your pane and make you scroll a lot when you are working on visualizations and making measures in the Report view.
How do I hide a table?

Very simple. Click the more option button (three dots) on the right side of the table and then choose [Hide].

It will still show in the Data view and Data Model view, but either greyed out or with the hidden sign.
If you want to unhide it, in the Data or Model views, click the more option button again and uncheck [Hide in report view].
Conclusion
Voila! There you have it. These 3 helpful Power BI Tips For Beginners that will help you organize your DAX codes and dashboards, so you can quickly work on them regardless of how far in the future you may come back to them. I always use these methods on my dashboards and I highly recommend you try them. They will provide the flexibility and efficiency that will serve you well in the long run. Easily share these three tips using the infographic on 3 Helpful Power BI Tips For Beginners. And comment down below if you have any experience where these tips and tricks have saved you time, effort, or a headache, or if you have your own tips and tricks that you swear by.


Comments