Tabular Editor: Power BI Time Saver
- Soo Reed

- Jul 26, 2021
- 6 min read
Updated: Oct 3, 2022
Save time developing Power BI report with Tabular Editor
Even though Power BI will SUM() any numeric value for you automatically, it is the best practice to write explicit measures that sum numeric columns and refer to them in more complex measures. So what hinders people from doing so all the time? I dare to say the Power BI speed. When you use Power BI desktop UI to create measures, sometimes it over-thinks and it takes forever to create them! Even if it creates measures quickly, who wants to spend 15 minutes or longer writing SUM() for all the numeric columns? I sure don’t! So for me, using the external tool Tabular Editor has been a game changer. It dramatically reduced the stress and time developing even the most basic Power BI report.
So how do you get this Tabular Editor?
Download Tabular Editor from this link. Once you are done downloading, turn off/on Power BI – then it should automatically add the “External Tools” tab and show Tabular Editor on it.

How do you use this Tabular Editor?
Tabular Editor is a powerful tool and its world is vast. As I want to introduce you to it rather than giving you all the details, this blog will not go in-depth on Tabular Editor — if you want to learn more about it, there’s a ton of free resources out there you can learn from. I will add a few of them at the bottom. But for this blog, I will show you how to use this amazing tool to create multiple SUM() measures from metric columns at once and a couple of other easy ways to use Tabular Editor to save time developing Power BI reports.
Content: 1. how to create sum() for multiple columns at once 2. Change format of data easily using Tabular Editor 3. Use Tabular Editor to quickly change Measures’ locations
1. How to create SUM() for multiple columns at once
For SUM() but for also other wonderful things Tabular Editor can do, you will want to bookmark this site: https://docs.tabulareditor.com/Useful-script-snippets.html This site provides you much of what Tabular Editor can do, but here, we will focus on the first subheading:[Create measures from columns] under [Useful Script Snippets]. This is the snippet:
// Creates a SUM measure for every currently selected column and hide the column. foreach(var c in Selected.Columns) { var newMeasure = c.Table.AddMeasure( “Sum of ” + c.Name, // Name “SUM(” + c.DaxObjectFullName + “)”, // DAX expression c.DisplayFolder // Display Folder );
// Set the format string on the new measure: newMeasure.FormatString = “0.00”;
// Provide some documentation: newMeasure.Description = “This measure is the sum of column ” + c.DaxObjectFullName;
// Hide the base column: c.IsHidden = true; }
Tell me a bit about this script snippet?
Long story short, Tabular Editor uses C# syntax in advanced scripting. So if you know C#, this probably looks familiar and you can do cooler stuff with it. But for now, let’s just look at this [Create measures from columns] more specifically.
foreach(var c in Selected.Columns) — this is for loop; basically for each of the selected columns (the columns you will be selecting), it has a variable c.
var newMeasure = c.Table.AddMeasure( — for each var c, create a new measure in variable c’s current table and call the built in function called “AddMeasures.
“Sum of ” + c.Name, — make the name of the measure as Sum of the variable c name, which is the column name. So if you do not want “Sum of “ but “Total “ then you can modify this part and make it “Total “ + c.Name
“SUM(” + c.DaxObjectFullName + “)”, — this is basically what you would write as DAX but written in string concatenation. Since, to get a sum of a column, you would write “SUM(column name)”, that’s what it is doing.
// Set the format string on the new measure: newMeasure.FormatString = “0.00”; —It is setting the format of the created measure. If you do not want 0.00 but something else, you can modify this. For this formatting, you can also look at the later part of my blog “2. Change format of data easily using Tabular Editor”.
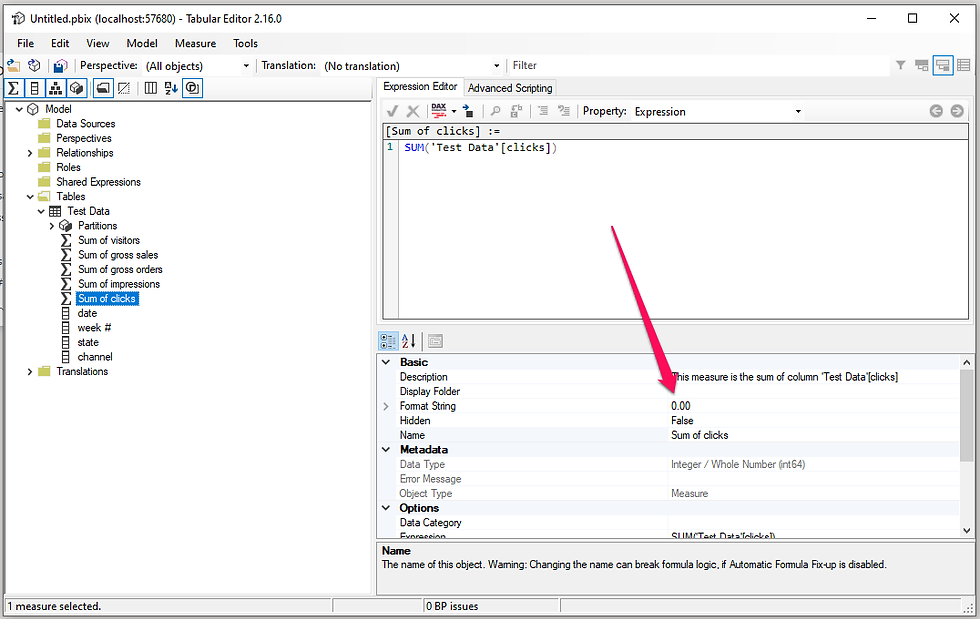
// Provide some documentation: newMeasure.Description = “This measure is the sum of column ” + c.DaxObjectFullName; —This is a documentation of your new measure which you can see in the Tabular Editor. Screenshot:

// Hide the base column: c.IsHidden = true; —This line hides the original metric column so you or other developers or users use the metric columns but only use the created measure. You can see that it’s even hidden in Tabular Editor:

These hidden ones are shown in Model with a crossed-eye icon:
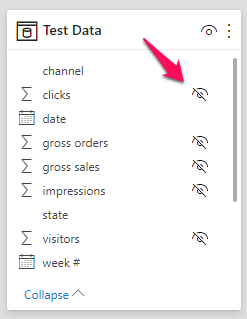
To unhide it, you only need to click the eye. Then it will not be hidden anymore. Hiding such metric columns is recommended as once you have SUM() for the columns, you should not be using the column but only use the measure for it.
How do I use these snippets?
In Power BI, go to External tool and open your tabular editor. By default, you are on [Expression Editor] — click [Advanced Scripting] as shown below in the screenshot. Add the script from above.

Now, before you run it, click [Tables] and find the metric columns you want to create SUM() of. Click multiple of them using the Ctrl key. Then run it.

Once you run it, you will see the created measures in the same table like in the screenshot:

If desired, you can double click the measure and change the name or move the measure to another folder by dragging and dropping using your mouse. More in the “3. Use Tabular Editor to quickly change Measures’ locations”. When you are done, go to [File] and [save]. The changes will be applied in your power bi report.
2. Change format of data easily using Tabular Editor
Power BI sometimes tests my patience by thinking too much when I change the data format for measures using their built in UI. With the Tabular Editor, however, I can change the data format for measures so quickly and easily! All you have to do is to write the format you want in [format string] of a measure as shown in screenshot:
What should I put there to get the format I want?
Here’s the list of the format string I use the most. Just copy and paste it to the [Format String]:
Two decimal: #,0.00 whole number: #,0 $ currency without decimal: \$#,0;(\$#,0);\$#,0 $ currency with two decimal: \$#,0.00;(\$#,0.00);\$#,0.00 two decimal %: 0.00%;-0.00%;0.00% one decimal %: 0.0%;-0.0%;0.0%
***two decimal, whole number, and both currency will appear with comma (,) as a thousands separator.
3. Use Tabular Editor to quickly change Measures’ locations
No more moving measures and waiting while Power BI is thinking about your request! You can easily drag the measure you want to move and place it in a new table. Drag and drop, it’s as simple as that. One more awesome thing, if you have many measures and want to categorize them in different folders, you can do so using Tabular Editor! In the Tabular Editor, right click the measure you want to put within a folder you will create. Select “Create New” and “Display Folder”. Now you have a folder and the measure within it! You can drag and drop other measures into the folders as you would like.

4. Others
As mentioned above, Tabular Editor can be used in so many ways and I only scratched the surface of its functionality. For instance, creating a Calculation Group is one of the most popular ways Tabular Editor is used. A calculated table is something only Tabular Editor can do currently, and it can save you a ton of time. But it is out of scope of this blog. I will add a few related resources in the “Additional Resources” part next.
Conclusion
With the theme of saving Power BI development time, this blog scratched the surface on tabular editor’s ability. Even though the blog only dealt with very basic functionality and simple SUM() measures, it can already save you a ton of Power BI development time. Instead of starting with a vague concept, I hope this easily applicable introduction to Tabular Editor has got you excited to explore more of its wonderful features. To learn more about Tabular Editor, check out additional resources below.
Additional Resources
Tabular editor doc page I referred to this site earlier, but I cannot emphasize enough how useful it is. Please check it out.
YouTube video by PowerBI.Tips on Tabular Editor I highly recommend watching the 4 videos to learn the full capacity of Tabular Editor.


Comments